Department of Science and Technology
Philippine Atmospheric, Geophysical and
Astronomical Services Administration
Astronomical Services Administration
Philippine Standard Time
07:36:50 PM
12 July 2025
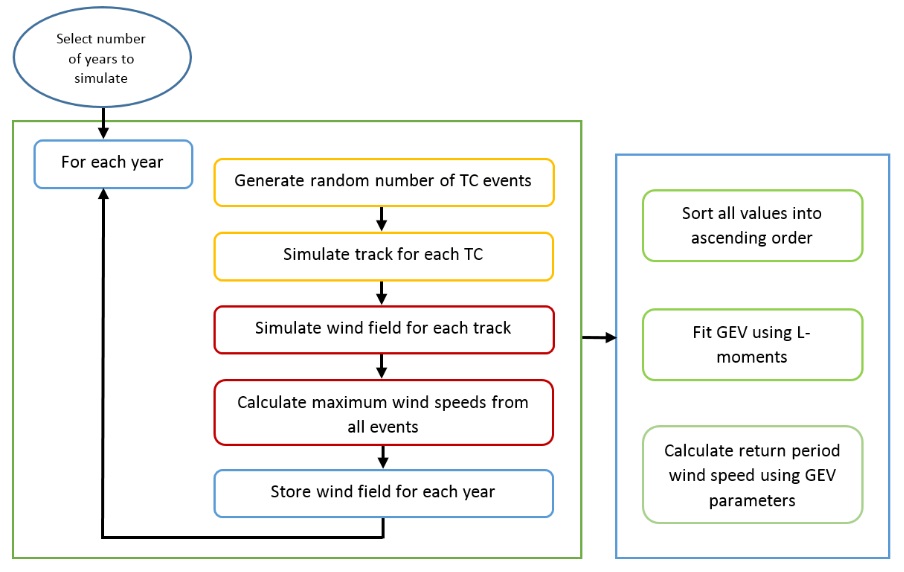
The Regional Severe Wind Hazard map represents the 3-second peak gust wind speed measured at 10-meter height (above ground) over open and flat terrain. This does not take into account the local factors such as topography, terrain roughness and shielding from neighboring structures. In order to generate the regional severe wind hazard, the Tropical Cyclone Risk Model (TCRM), developed by Geoscience Australia (GA) was used. The model uses statistical and parametric models to simulate the behavior of thousand years of cyclonic activities. Powell (2005) parametric wind field and Kepert (2001) boundary layer models were employed for each tropical cyclone.
Furthermore, the wind speeds from all events are fitted to the Generalized Extreme Value (GEV) distribution to determine an average recurrence interval or annual exceedence probability for a given wind speeds. The model output is combined with the analysis of the observed maximum wind speed (3-second peak gust) to adjust the various return periods (RPs) of maximum wind gust, which are determined using a Generalized Pareto Distribution (GPD). Historical tropical cyclone dataset from 1951 – 2017 archived of the Japan Meteorological Agency (JMA) were also utilized.
The regional severe wind hazard generated for the tropical cyclones that passed through the Philippine Area of Responsibility (PAR) are expressed in terms of return periods. These wind fields show the probability of any given magnitude that may occur in any given year. Various return periods were derived in the study such as 20, 50, 100, 200 and 500 year return periods (RPs). Simulated regional severe wind hazards were refined using the observation data of PAGASA stations (1951-2017) to accurately display sub-regional variations.
The regional severe wind hazard maps will provide a valuable source of information that will serve as a guide for disaster managers and planners for future tropical cyclone emergency planning and for disaster risk reduction. This will also identify areas likely to suffer significant wind damage due to tropical cyclone severe wind and to prepare the community to understand the behavior and characteristics of tropical cyclone winds. In addition, it will also enable the disaster planners/managers to build a wind-proof community and minimize the damaging effects of tropical cyclone wind and make informed decisions.
Figure 1 below shows the process in estimating the regional severe wind hazard levels. The historical tropical cyclone track dataset that entered the Philippine Area of Responsibility (PAR) from 1951 to 2017 was used to derive the wind hazard (Monteverde et al., 2017). Return period wind fields were computed by getting an average over a duration of time and extrapolated to calculate the probable distribution of wind speed across the country. The model generated the regional wind speed and utilized distribution of tropical cyclone properties (speed, bearing, and intensity) developed on a grid covering the PAR.